Challenges
- Existing data spread across multiple spreadsheets, making analysis difficult
- Manual commission calculations and performance metric tracking
- Lack of visual representation for key goals and trends
- Inefficient data entry process for sales staff
Benefit one: Consolidated data management
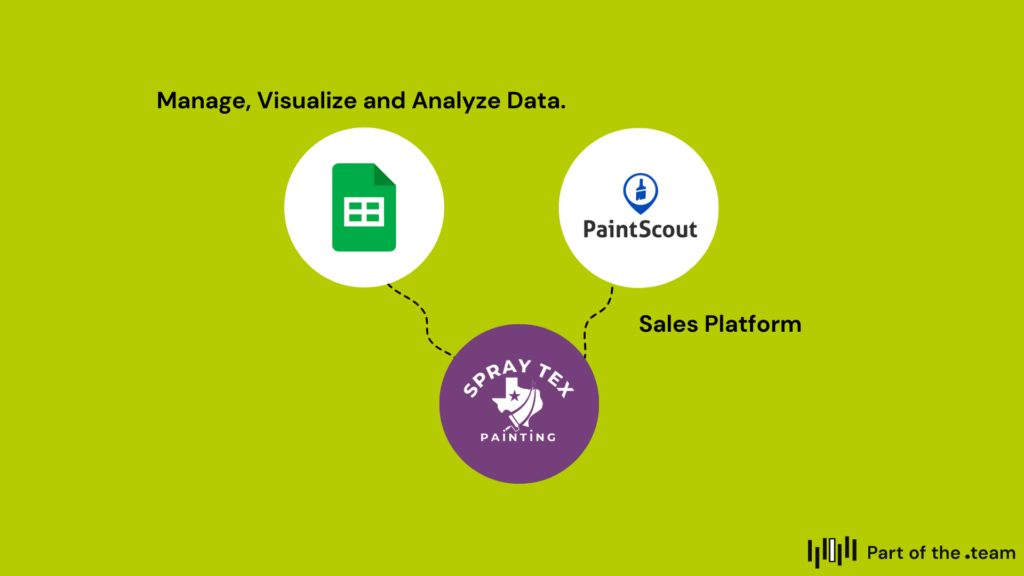
The new Google Sheets dashboard consolidated data from existing spreadsheets, GoHighLevel CRM, and Paintscout, streamlining the sales tracking process.
Benefit two: Enhanced performance analysis
Custom formulas for commission calculations and performance metrics were developed, providing valuable insights for coaching and decision-making.
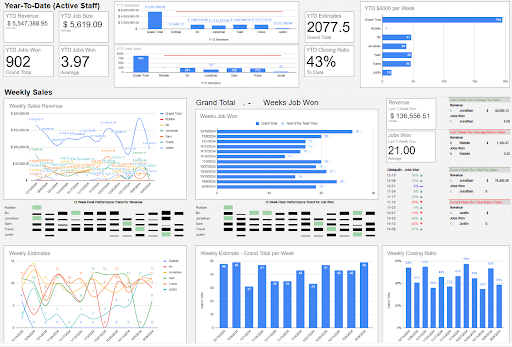
Benefit three: Improved visualization
Graphical representations of key data, weekly comparison views, and trend analysis charts were implemented, enabling quick and easy performance assessment.
Objectives
“We need a Spreadsheet Wizard: Create a Data Spreadsheet for a Sales Team with coding.”
Spray Text Painting sought to implement a user-friendly Google Sheets dashboard during its Christmas close-down period. It wanted to start the new year by consolidating data from multiple sources, enabling efficient sales performance tracking, and simplifying commission calculations, while maintaining confidentiality.
Solutions
Part of the .team worked with Spray Text Painting’s representative to create a comprehensive Google Sheets dashboard, advising on new metrics that could be introduced. We began by consolidating data from existing spreadsheets and integrating information from GoHighLevel CRM and Paintscout.
In the second phase, we developed custom formulas for commission calculations and performance metrics. We also implemented data filtering and sorting capabilities, along with graphical representations of key data and trend analysis charts.
The third phase focused on optimizing the user interface. We simplified the data entry process for sales staff and created an intuitive layout for easy navigation. User guides and documentation were prepared to support ongoing use.
The final phase involved thorough testing of all features and making necessary adjustments based on feedback. We provided support materials for ongoing use and ensured the dashboard was ready for handover by the January deadline.
Improved sales analysis enabled the client to improve its profitability, in addition to revenue levels.
“Wow I’m blown away by what you’ve achieved”